Rastrigin test function for optimization algorithms
This function is used to test optimization algorithms. It is a non-convex function with many local minima, making it a challenging problem for optimization algorithms.
from math import cos, pi
from collections.abc import Sequence

from pandas import DataFrame
from plotnine import ggplot, aes, geom_point, ggtitle, facet_wrap, coord_fixed

from altbacken.core.annealing import SimulatedAnnealing, TemperatureFunction
from altbacken.external.annealing import SimpleSimulatedAnnealing
from altbacken.external.neighbourhood.numeric import VectorNeighbourhood
from altbacken.external.temperature import ExponentialCooling
from altbacken.internal.report.memory import DataFrameReport
from altbacken.external.temperature import LinearCooling
def rastrigin(point: Sequence[float]) -> float:
    return 10*len(point) + sum(x**2 - 10*cos(2*pi*x) for x in point)
rastrigin((0,0))
0.0
def create_annealing_with(temperature: TemperatureFunction) -> SimulatedAnnealing[Sequence[float]]:
    return SimpleSimulatedAnnealing(
        rastrigin,
        VectorNeighbourhood(0.5),
        temperature,
        stop=10000
)
def simulate(temperature: TemperatureFunction) -> DataFrame:
    report: DataFrameReport = DataFrameReport()
    annealing = create_annealing_with(temperature)
    annealing.tracer = report
    annealing.simulate([4.0, 4.0])
    return report.frame
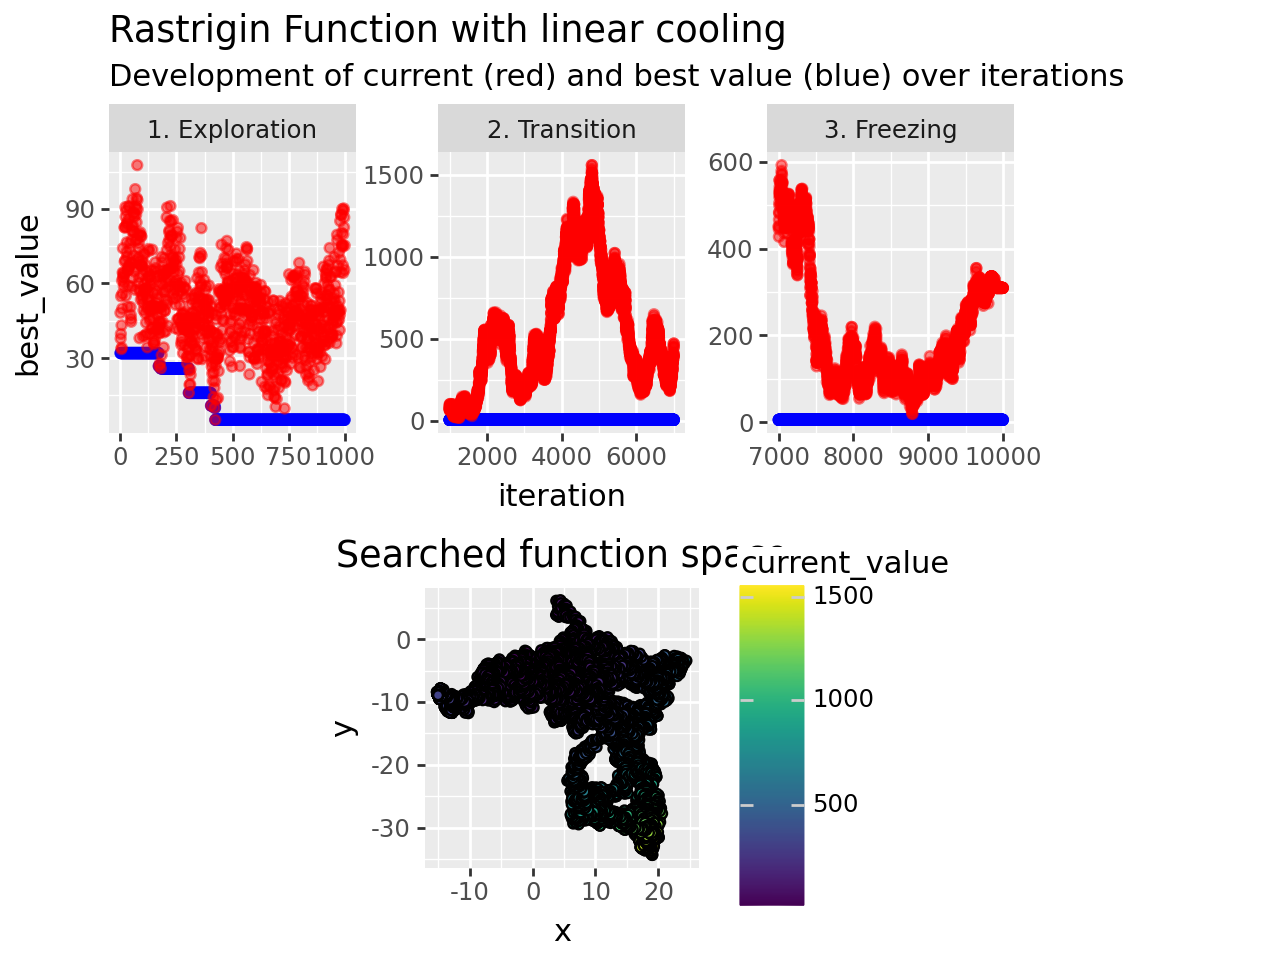
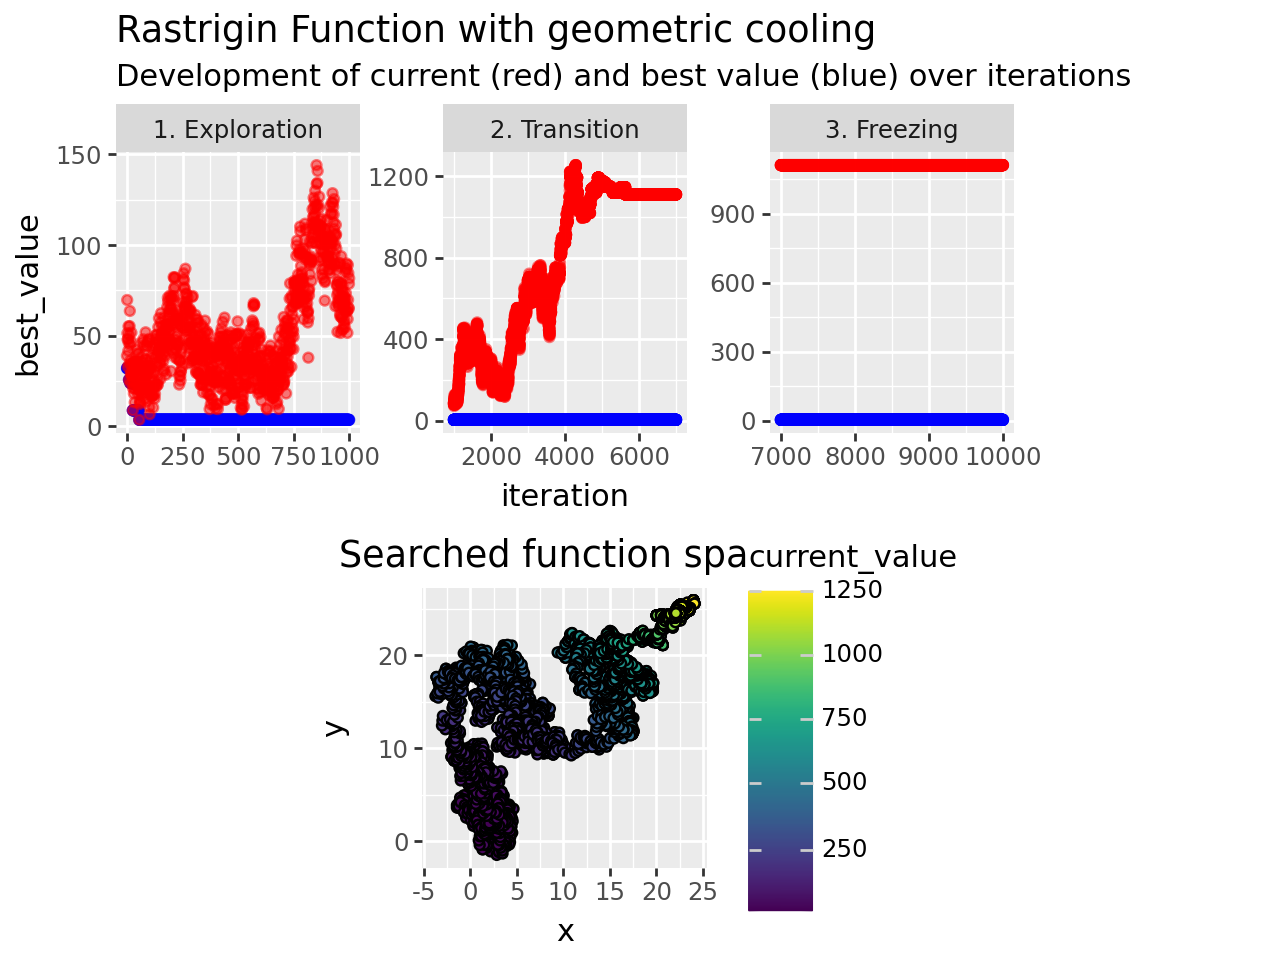
def phase_name(iteration: int) -> str:
    if iteration <= 1000: return "1. Exploration"
    elif iteration <= 7000: return "2. Transition"
    else: return "3. Freezing"
def show_plot(df: DataFrame, for_: str):
    df["phase"] = df.iteration.map(phase_name)
    df["x"] = df.current_solution.map(lambda x: x[0])
    df["y"] = df.current_solution.map(lambda x: x[1])
    dist = ggplot(df, aes(x="iteration", y="best_value"))\
    + geom_point(color="blue", alpha=0.5) + geom_point(aes(y="current_value"), color="red", alpha=0.5) \
    + ggtitle(f"Rastrigin Function with {for_} cooling", "Development of current (red) and best value (blue) over iterations")\
    + facet_wrap("phase", scales="free")
    explored = ggplot(df, aes(x="x", y="y", fill="current_value"))\
    + geom_point()\
    + ggtitle("Searched function space") \
    + coord_fixed()
    return dist / explored
def simulate_and_show(cooling: TemperatureFunction, name: str):
    return show_plot(simulate(cooling), name)
simulate_and_show(ExponentialCooling(10000.0, 0.99931), "geometric")
simulate_and_show(LinearCooling(10000.0, 1.0), "linear")